
Woordenschat voor IELTS Academic (Score 5) - Grafieken en Figuren
Hier leer je enkele Engelse woorden met betrekking tot grafieken en figuren die nodig zijn voor het Basic Academic IELTS-examen.
Herzien
Flashcards
Spelling
Quiz
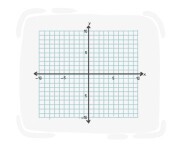
a diagram using points, lines, or similar marks to show relationships between numerical quantities

grafiek

an information sheet in the form of a graph, diagram, or table that is easy to understand
grafiek, tabel
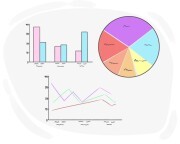
a simplified drawing or plan used to show the parts, structure, operation, or relationships of something
diagram
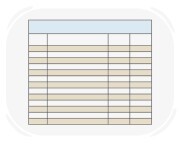
a set of facts and figures arranged in rows and columns in a systematic order
tabel, tafel

the topmost point on a graph that indicates the highest level reached during a progression or development
piek, top
an arrangement of a set of figures or information in a vertical way
kolom, verticale kolom
a sequence of related items, events, or actions that follow one after the other in a particular order
reeks, serie
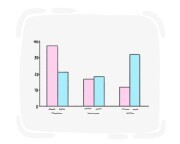
a graphical display of information consisting of narrow rectangular lines whose heights depend on the value that they are representing
staafdiagram, histogram
Bij het lezen van een staafdiagram is het belangrijk om naar de schaal te kijken voor een accurate interpretatie.
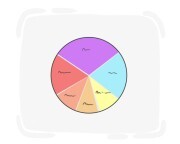
a graphical display of the difference between the parts of a whole shown by dividing a circle into several segments
taartdiagram, cirkeldiagram
Het taartdiagram toonde duidelijk aan dat de meerderheid van de respondenten optie A verkoos.
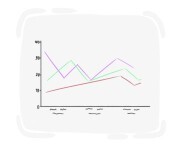
a graphical display of the relationship between two points connected to each other by lines
lijngrafiek, lijnendiagram
Elk punt op het lijndiagram vertegenwoordigt een andere meting.
| Woordenschat voor IELTS Academic (Score 5) | |||
|---|---|---|---|
| Education | Onderzoek | Astronomie | Natuurkunde |
| Biologie | Scheikunde | Geologie | Psychologie |
| Wiskunde | Grafieken en Figuren | Geometrie | Milieu |
| Energie en Vermogen | Landschappen en Geografie | Technologie | Computer |
| Internet | Productie en Industrie | Geschiedenis | Religion |
