
Wortschatz für IELTS Academic (Punktzahl 5) - Grafiken und Abbildungen
Hier lernen Sie einige englische Wörter zu Graphen und Figuren, die für die grundlegende akademische IELTS-Prüfung notwendig sind.
Überprüfen
Lernkarten
Rechtschreibung
Quiz

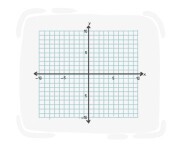
a diagram using points, lines, or similar marks to show relationships between numerical quantities

Graph (m)

an information sheet in the form of a graph, diagram, or table that is easy to understand
Diagramm
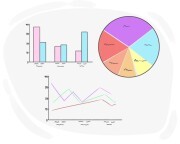
a simplified drawing or plan used to show the parts, structure, operation, or relationships of something
Diagramm
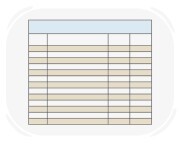
a set of facts and figures arranged in rows and columns in a systematic order
Tabelle

the topmost point on a graph that indicates the highest level reached during a progression or development
Spitze, Gipfel
an arrangement of a set of figures or information in a vertical way
Spalte
a sequence of related items, events, or actions that follow one after the other in a particular order
Reihe, Serie
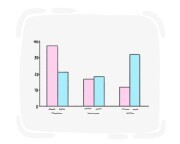
a graphical display of information consisting of narrow rectangular lines whose heights depend on the value that they are representing
Säulendiagramm
Jeder Balken im Balkendiagramm stellt eine bestimmte Kategorie dar.
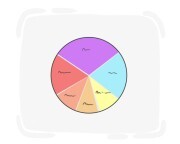
a graphical display of the difference between the parts of a whole shown by dividing a circle into several segments
Kreisdiagramm
Um die Umfrageergebnisse zu visualisieren, haben wir ein Kreisdiagramm erstellt, das den Prozentsatz der verschiedenen Altersgruppen darstellt.
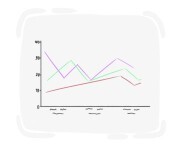
a graphical display of the relationship between two points connected to each other by lines
Liniendiagramm
Ein Liniendiagramm kann helfen, Verkaufstrends für ein Unternehmen zu verfolgen.
| Wortschatz für IELTS Academic (Punktzahl 5) | |||
|---|---|---|---|
| Education | Forschung | Astronomie | Physik |
| Biologie | Chemie | Geologie | Psychologie |
| Mathematik | Grafiken und Abbildungen | Geometrie | Umwelt |
| Energie und Leistung | Landschaften und Geographie | Technologie | Computer |
| Internet | Herstellung und Industrie | Geschichte | Religion |
